
One of the most important activities for the people that oversee manufacturing environments is to take decisions regarding the performance of the process. The performance includes several and various topics: safety, productivity, quality, availability, etc. that are occurring, and changing every day. If we visualize it as a process, we can represent it in the next diagram:
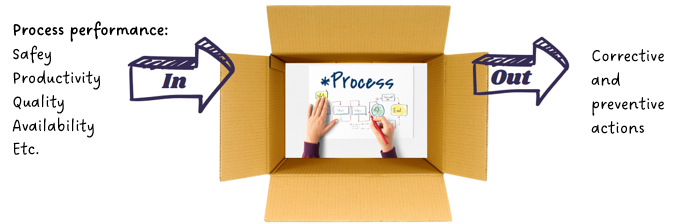
So, to generate appropriate decisions to correct any deviations or event to prevent them, the key remain to have the correct data of the process performance at the right time and in the right place.
In the traditional manufacturing processes since the middle of the 20th century, the companies started and improved the implementation of different techniques to capture the process data. These techniques were based on manual activities with the use of paper templates. With the propagation of the use of computers at the 90´s and at the beginning of 21st century, the papers were replaced by spreadsheets (i.e. Excel). This improvement generated a reinforcement in the visual management and the use of bigger data bases, but it remains some difficulties due to the technological limits: there are several steps and persons related to capture the data, the time were the reports have a delay of hours or even days vs the data capture.
With a fast internet and cloud computing data storage appears the possibility to assurance the quality of the data, taking it directly in the source, and generating reports in real time.
The new solutions available in the market give answers to any manufacturing company to capture and manage the company performance information. With these tools today is possible to:
Real-time visibility: allows stakeholders to access up-to-date information instantly, enabling faster decision-making and responsiveness.
Centralized data and reporting: eliminate the need for manual data gathering and reporting. Improve data accuracy, reduce the risk of errors, and save time. Focus on Problem Solving and Communication rather than generating reports and graphs.
Data-driven insights: transform data into actionable insights. By visualizing data through charts, graphs, and trends, decision-makers can quickly identify patterns, spot areas of improvement or concern, and make data-driven decisions to optimize performance.
Goal tracking and performance monitoring: set and track goals effectively. By visualizing progress towards targets, teams can monitor performance against key metrics and take timely actions to stay on track. This enhances goal alignment, motivates employees, and improves overall performance.
Enhanced collaboration and communication: teams and departments can collaborate more effectively. By sharing a common view of key metrics, everyone can align their efforts towards shared goals, track progress, and communicate more efficiently. This improves cross-functional collaboration and fosters a culture of transparency and accountability.
Customization and scalability: customize & tailor the dashboard to your specific needs and metrics. The solution is scalable, accommodates growth and evolving reporting requirements.
Mobile accessibility: accessible anytime and anywhere. This mobility ensures that decision-makers have access to critical information even when they are on the go, promoting agility and responsiveness.
With all those capabilities the possibility to take corrective decisions once the problem occurs is easy and feasible and, in addition, with the chance of record these actions the companies start to grow up their knowledge management system.
Now, there are no limits to promote a culture of continuous improvement. By regularly reviewing and analyzing performance metrics, we can identify opportunities for optimization, set new targets, and track the impact of improvement initiatives over time. Even, the visual management system in the factory could be improved implementing real time score cards and indicators big screens where all the employees could visualize the process performance.
If you want to know more about this topic, please contact me by Linkedin or directly at www.qts.com.co
Comentarios